We recently upgraded the user experience on our brokerage platform by introducing a pro charting mode: candlestick charts for all US stocks, ETFs and options. It supports every granularity, from 1-second bars up to monthly, with history going back to 2003. It also has to page backwards smoothly as you scroll. (Live updates to the current candle arrive over a separate streaming path, which isn’t covered here. This post is about history.)
The obvious design is the one everyone reaches for first. Ingest the bars into your own database, run a daily job to keep it topped up, and serve the chart from there. We sized that, and then didn’t build it.
Short version: the market-data vendor already holds split-adjusted history at every depth we needed, so the service became a thin proxy over it. In front of the vendor sits a Redis cache cut into time buckets, and in front of each bucket sits a cross-pod Redis lock, so the vendor sees one call per bucket however many users or pods ask for it. In our test environment the server’s median response was 19–25 ms across runs, 93.8% of buckets were served without touching the vendor, and 40 identical cold requests spread across two pods made exactly one vendor call.
Getting that lock right took three designs. That part is the most interesting, but the storage numbers come first, because they’re why there’s a cache at all.
Measure before you size
The first back-of-the-envelope estimate made the naive assumption: every ticker has a bar for every second of the extended trading day (04:00–20:00 ET), every trading day, for 15 years. That came out at about 177 TB.
That number would have justified a serious storage project, so before anyone started one, we pulled a single real trading day of 1-second bars for every active US equity and looked at it.
| Value | |
|---|---|
| Tickers | 13,519 |
| Bars in the day | 8.86 million |
| Share of the theoretical maximum | 1.14% |
| Bars per ticker | median 66 · p90 1.7k · p99 8.7k · max ~29.5k |
| Tickers with zero trades that day | 1,420 |
| On disk (Cassandra, LZ4) | 268 MB/day, about 30 bytes per bar |
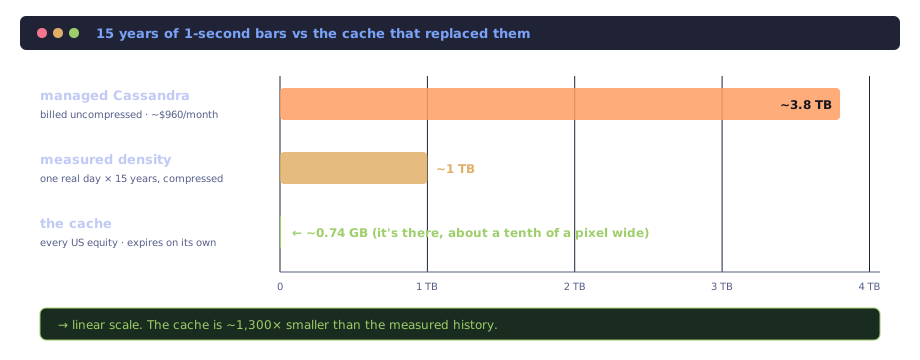
Real markets are sparse. Half the tickers traded in fewer than 70 distinct seconds that day. At measured density, 15 years of 1-second history is about a terabyte, not 177 TB.
And that’s equities alone. Ingesting options data as well would increase the data requirements by orders of magnitude. To keep this post focused, the numbers and design discussion here stick to US stocks and ETFs.
A terabyte is manageable, but it’s still a terabyte that only grows, and someone has to keep the daily ingest job healthy. Fetching that one day alone took over 13 minutes on 16 threads.
It isn’t free either. Here’s a rough price for 15 years of 1-second bars on a managed Cassandra service (Amazon Keyspaces, on-demand, us-east-1, public pricing as of September 2026). Keyspaces bills storage on uncompressed size plus 100 bytes of metadata per row, so our 1.79 million rows a day (one per ticker per minute) bill as about 1 GB a day, not 268 MB:
| Estimate | |
|---|---|
| Backfill, 15 years (~6.8 billion row writes at $0.625 per million) | ~$4,200 once |
| Storage at full depth (~3.8 TB at $0.25 per GB-month) | ~$960 a month, rising ~$63 each year |
| Daily ingest (1.79 million row writes) | ~$1 a day |
That’s for 1-second bars alone. It excludes reads, backups and the engineering time to run it. Meanwhile the vendor already had all of this, split-adjusted, at every resolution the chart asked for.
So we didn’t store it. The cache that replaced the plan holds bars at about 36 bytes each (gzipped JSON), and every entry expires on its own. We estimate ~245 MB for a month of typical use across 2,000 tickers, and ~740 MB if every US equity ended up cached.
Be a thin, faithful proxy
Every request maps one-to-one to a series the vendor already serves, and bars go back exactly as the vendor sent them. The service doesn’t merge bars into other resolutions or restamp their times.
That matters for three reasons:
- One request = one vendor series = one cache key. If one cached series had to serve several requested ones, the bucket boundaries would grow odd edge cases.
- The API doesn’t care about time zones. A bar’s timestamp is the Unix millisecond of its start, as the vendor sends it, and the client renders it in exchange time.
- There’s less to be wrong about. The vendor’s daily bar uses the official closing price. A sum of minute bars doesn’t: the closing auction prints at 16:00:00 and lands in the first post-market minute bar.
The one thing the service adds is a session filter, applied after reading. An intraday bar is kept if it overlaps a session the caller selected (pre-market, regular or post-market). The vendor’s clock-aligned 09:00 hour bar therefore counts as “market hours” even though half of it is pre-market, which is how most charting tools show it.
Cut time into buckets
A chart request is a window: one ticker, one resolution, one from–to range. You can’t cache windows directly, because no two users scroll to exactly the same one. So the cache stores fixed buckets of time, sized per resolution, and a window becomes “whichever buckets it touches”.
| Requested series | Bucket | TTL once closed | TTL while open (contains “now”) |
|---|---|---|---|
| 1-second bars | 1 hour | 1 day | 2 s |
| Minute bars, multiplier < 30 | 1 ET day | 7 days | 5 s |
| Minute ≥ 30, and hourly | 1 ET month | 30 days | 60 s |
| Daily and longer | 1 ET year | 30 days | 5 min |
The sizes keep a bucket at a few hundred to a few thousand bars. One liquid ticker’s day of 5-minute bars, for example, is about 192 bars and roughly 8 KB in the response.
The whole policy fits in a small object:
private enum class Unit(val openTtl: Duration, val closedTtl: Duration) {
    HOUR(Duration.ofSeconds(2), Duration.ofDays(1)),
    DAY(Duration.ofSeconds(5), Duration.ofDays(7)),
    MONTH(Duration.ofSeconds(60), Duration.ofDays(30)),
    YEAR(Duration.ofMinutes(5), Duration.ofDays(30))
}

fun ttl(series: CandleSeries, bucketStart: Long, nowMs: Long): Duration =
    unit(series).let { if (nowMs >= endOf(series, bucketStart) + 60_000L) it.closedTtl else it.openTtl }
A few rules turned out to matter more than the table:
- Buckets hold raw vendor bars. The session filter runs after the read, so one bucket serves every session combination.
- A bucket counts as closed only 60 s after its end, which leaves time for late prints.
- Empty buckets are cached as
[]. Weekends, holidays and halted tickers never go back to the vendor. - Only successful fetches get written. A cached value that fails to decode is treated as a miss, never as a 500.
- Consecutive misses are fetched in one vendor call covering the whole run, then split and written per bucket. A 60-day 1-minute window with two days already cached made exactly three vendor calls, one per run of missing days.
- Redis is optional. Any Redis error falls back to fetching straight from the vendor, and the request still succeeds.
Open buckets are the interesting case. The bucket containing “now” for 1-second bars lives for two seconds, so at the market open, every chart showing a popular ticker hits that bucket, and it has to be refetched every two seconds. That’s where the lock earns its keep.
One vendor call, any number of pods
Take that hot bucket: one popular ticker’s 1-second bars at 09:30, expiring every 2 s, with a crowd of users watching. Here are the options:
- No coalescing: every request that misses calls the vendor. That’s roughly (requests per second × vendor latency) calls on every refresh.
- Per-pod dedupe (an in-memory map of in-flight fetches): one call per pod per refresh. Better, but it grows with every pod you add, and the service runs several pods behind a load balancer.
- A lock in Redis: one call per refresh across the whole fleet. It’s the only option that stays flat as you scale out.
The basic shape is standard. On a miss, try SET lock:{bucket} <random token> NX PX 10000. Whoever wins fetches from the vendor and writes the bucket. Everyone else waits for the bucket to appear. The hard part is what the waiters do when the owner doesn’t deliver.
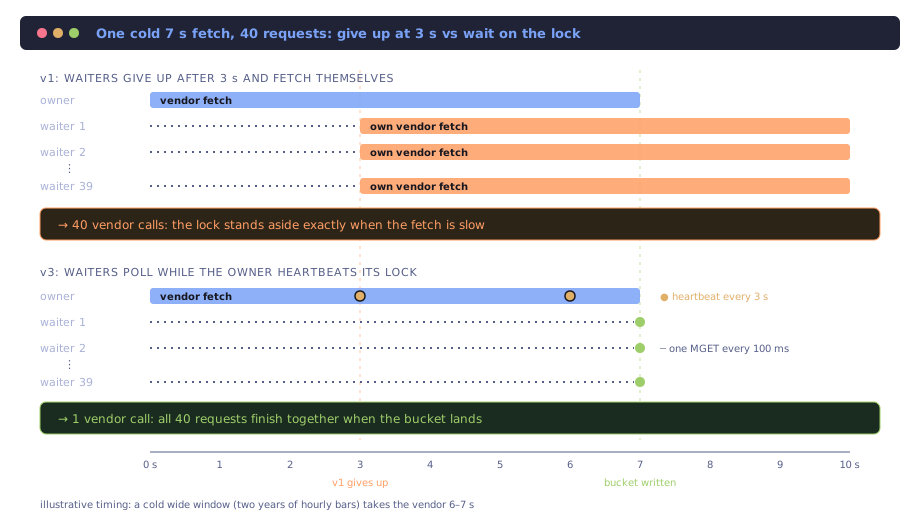
v1: wait about 3 seconds, then fetch it yourself
The first version had waiters poll for about three seconds, then give up and fetch without the lock. The aim was that a dead owner couldn’t stall anyone for long.
The catch is that waiters can also time out while a slow owner is still fetching. At first that looked like an acceptable price for never stalling 10 s behind a dead owner.
v2: wait as long as the lock exists, and have the owner heartbeat
Looking closer, the trade-off flipped, and it flipped on one number. A cold wide window, such as two years of hourly bars, takes the vendor 6–7 seconds to page through. With a 3-second give-up, every one of those slow fetches turned into N parallel vendor calls: the first owner still fetching and N−1 waiters who’d given up and started their own. The lock worked only when it wasn’t needed and stood aside exactly when it was. That defeats the point of having it.
So v2 changed two things:
- Waiters keep polling as long as the lock exists, with a hard cap.
- The owner heartbeats its lock, so a slow fetch never loses it.
v3: takeover and a failure marker
v2 handled the slow owner, but two other outcomes were left:
- The owner dies (pod killed mid-fetch). Waiters sit there until the cap.
- The owner’s fetch fails (the vendor errors after retries). Every waiter eventually times out or, worse, they all retry the vendor at once.
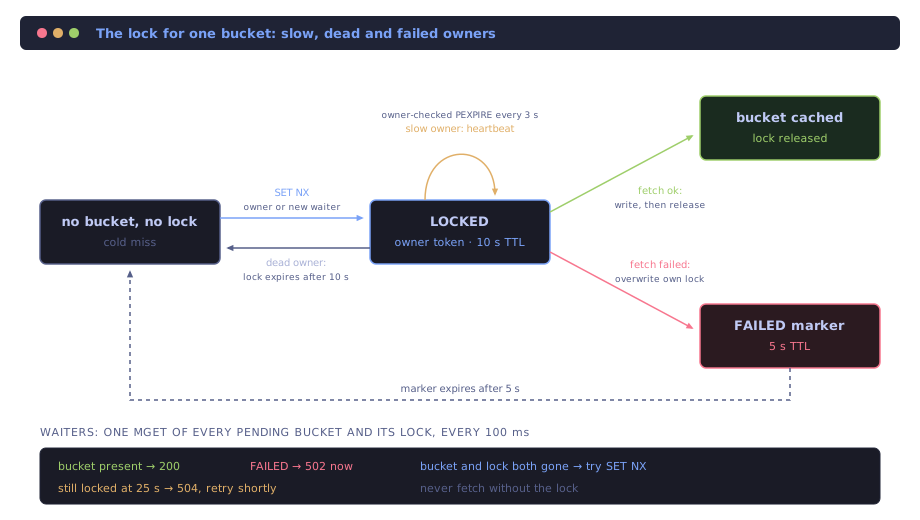
So the protocol that shipped treats each outcome with its own mechanism:
- On a miss,
SET lock:{bucket} <token> NX PX 10000for each missing bucket. - The owner:
- re-reads the buckets after locking, because a previous owner may have just finished;
- fetches each run of consecutive misses (8 s timeout per attempt, up to 3 retries on 429/5xx with jittered backoff from 0.5 s to 4 s, at most 10 pages);
- refreshes its locks every 3 s while fetching;
- writes the buckets, then releases each lock.
- If the fetch fails, the owner overwrites its own lock with
FAILEDfor 5 s. Waiters see the marker and return 502 immediately, without calling the vendor. - Waiters run one poll loop for everything they’re waiting on: a single
MGETof each bucket and its lock every 100 ms.- Bucket present → use it.
- Lock says
FAILED→ 502 now. - Bucket and lock both gone (the owner released without writing, or its pod died and the lock expired) → try to take the lock with a new token. The winner becomes the new owner.
- Still locked after 25 s → 504, “still loading, retry shortly”. That’s well under the gateway’s 60 s timeout, and time spent fetching as a new owner doesn’t count against it.
- Waiters never fetch without the lock. The one exception is when Redis itself is down.
Every write to a lock goes through a tiny Lua script, and each one is “only if I still own it”:
-- release
if redis.call('get', KEYS[1]) == ARGV[1] then return redis.call('del', KEYS[1]) else return 0 end
-- heartbeat
if redis.call('get', KEYS[1]) == ARGV[1] then return redis.call('pexpire', KEYS[1], ARGV[2]) else return 0 end
-- mark failed
if redis.call('get', KEYS[1]) == ARGV[1] then redis.call('set', KEYS[1], ARGV[2], 'PX', ARGV[3]) return 1 else return 0 end
Without the owner check, an owner whose lock had expired and been taken over could delete or extend the new owner’s lock.
The service is reactive (Spring WebFlux), so waiting is timer-driven and no thread is parked while a request polls. The heartbeat has a neat Reactor shape: merge an infinite Flux.interval with the actual work and take the first thing that emits. The work’s result wins, and the heartbeat is cancelled in the same moment.
val heartbeat = Flux.interval(HEARTBEAT_INTERVAL)
    .concatMap { Flux.fromIterable(won).concatMap { extend(lockOf(it), token) } }.then()
return Flux.merge(heartbeat.then(Mono.empty<Map<Long, List<CandleBar>>>()), work).next()
The timings, all in one place:
| Setting | Value |
|---|---|
| Lock TTL | 10 s |
| Heartbeat interval | 3 s |
| Waiter poll | 100 ms, one MGET for all pending buckets and their locks |
| Failure marker | 5 s |
| Waiter cap | 25 s → 504 |
| Vendor attempt timeout | 8 s |
| Vendor retries | 3, backoff 0.5–4 s with jitter |
| Max vendor pages per fetch | 10 |
What I’d take from this to any other cache-stampede lock:
- “Give up and fetch it yourself” feels safe, and it’s the wrong default. It turns every slow fetch into a thundering herd, which is exactly the case the lock exists for.
- Separate the three ways an owner can let you down. Slow → heartbeat. Dead → expiry plus takeover. Failed → marker plus fail fast. Each needs its own mechanism, and a single timeout can’t stand in for all three.
- Every lock write must check ownership. Otherwise a slow owner can delete or extend someone else’s lock.
Splits without SCAN or DEL
Closed buckets live for up to 30 days, and a stock split rescales every earlier adjusted bar. So the cache needs to forget one ticker instantly, on every pod, without scanning Redis for its keys.
The answer is a per-ticker generation number. It’s a plain integer in Redis, and it’s embedded in every bucket key and every lock key:
candles:{ticker}:g{generation}:{series}:{bucketStart}INCRon the generation makes every older bucket unreachable everywhere at once. The old entries simply expire on their own, with noSCANand noDEL.- A fetch already in flight writes under the old generation, so it can’t put stale bars back.
- A missing or unreadable generation reads as 0, so Redis trouble never fails a request.
Cash dividends don’t change adjusted prices, so they don’t need to trigger anything.
The charting library’s side of the contract
The chart asks for data the way charting libraries generally do: one ticker and one window at a time, with a few quirks the API has to honour.
- “At least N bars ending here”. The chart can ask for a minimum number of bars before a timestamp and ignore the start of the window. We walk back over real trading days, taken from the ticker’s daily bars, which are almost always cached in year buckets. Each round is sized from the bars per day seen so far, so thin tickers skip ahead fast. A request makes at most three rounds. A short answer is fine, because the chart asks again as you scroll.
- “No data” vs “next data is earlier”. We report “no data” only when nothing exists before the window, for example before the listing date. Otherwise, if the window is empty, we return the start of the newest earlier bar (looking back up to 5 trading days), so the chart can jump over the gap instead of paging through it.
- Caps. At most 2,000 bars per response, newest kept. Window limits per request (the chart pages back further by asking again): 1-second bars ≤ 1 day, minute ≤ 60 days, hourly ≤ 2 years, daily and longer unlimited.
- Delayed-data users only get bars that ended at least 15 minutes ago. The entitlement comes from the authenticated request, never from a parameter.
The numbers
We load-tested the finished service in a test environment with two pods. Server-side latency comes from APM. The cold→warm rows are client times that include about 1.1 s of port-forward overhead, so read them as relative.
| Result | |
|---|---|
| Requests | 1,853 |
| Server p50 / p90 / p99 | 24.9 ms / 91 ms / 531 ms |
| Max | 5.4 s (a cold 60-day 1-minute window) |
| Bucket hit rate | 93.8% (1,933 hits / 127 misses) |
| Vendor calls / 429s / failed fetches | 27 / 0 / 0 |
| 50 identical cold requests, one pod | 1 vendor call, all 200, slowest 1.9 s |
| 40 identical cold requests, two pods (20 each) | 1 vendor call, all 200, slowest 2.2 s |
| 20-year daily, cold → warm | 2.3 s → 0.23 s |
| 2-year hourly, cold → warm | 5.9 s → 0.56 s |
| 1 hour of 1-second bars, cold → warm | 0.81 s → 0.18 s |
| Concurrency 1 / 10 / 50 on a warm bucket | 0 failed requests |
The two-pod row is the one the lock was built for: 40 requests landing on two machines for the same cold data, and the vendor heard about it once.
One practical gotcha with load-testing a cache: the test environment’s Redis is shared. Re-running the test means picking new dates and tickers, or you’re measuring someone else’s warm cache instead of a genuine cold miss.